Probabilty gives us a way to both quantify the strength of the relationship (probably through regression) and to measure the uncertainty associated with our estimate.
A Preview: Conditioning
Conditional Probability is the foundation of statistics
We often want to know whether a group that has been “treated” by a policy intervention has different outcomes than a control group.
But…what do we mean by different?
We mean something like \(E[Y_{i}| X_{i} = 1]\) does not equal \(E[Y_{i}|X_{i} = 0]\), where X denotes treatment status.
To determine whether these expected values are different, we need to understand how they are distributed.
Why Bother with the Math?
Good social scientists need to understand what (conditional) probability they are estimating (excepting purely descriptive work)
Estimating the wrong (or uninteresting) conditional probability is a frequent problem
Being confident that we are estimating the right quantity of interest requires
Understanding probability (often skipped in applied stats courses)
Understanding the Data Generating Process (linking theory and expertise to empirical models)
Learning new Methods
Methods and Tools WILL change during your careers
Text-as-data (Dictionaries –> Bag of Words –> LLMs)
A new DiD estimator every month (slight exaggeration)
The rise and fall (and rise?) of instrumental variables
SPSS -> STATA -> R -> Python (?) -> Machine writes the code (???)
We want to lay a foundation so that you can adapt as tools change
Paul the Octopus
Paul the Prophet?
Paul picked 8 consecutive games correctly (all of Germany’s games + the final). What is the probability of correctly picking 8 consecutive games by chance?
The probability of randomly picking any single game correctly is 0.5. Intuitively, the odds of getting all 8 correct are \(0.5^{8}\) or \(\frac{1}{256}\)
Less than a 0.5% chance of getting all 8 right by chance. Usually, our statistical tests look for p < .05, this is p <.005. Thus, Paul can see the future!
Or can he? Next week, Reverand Bayes can help us think through this with rigor.
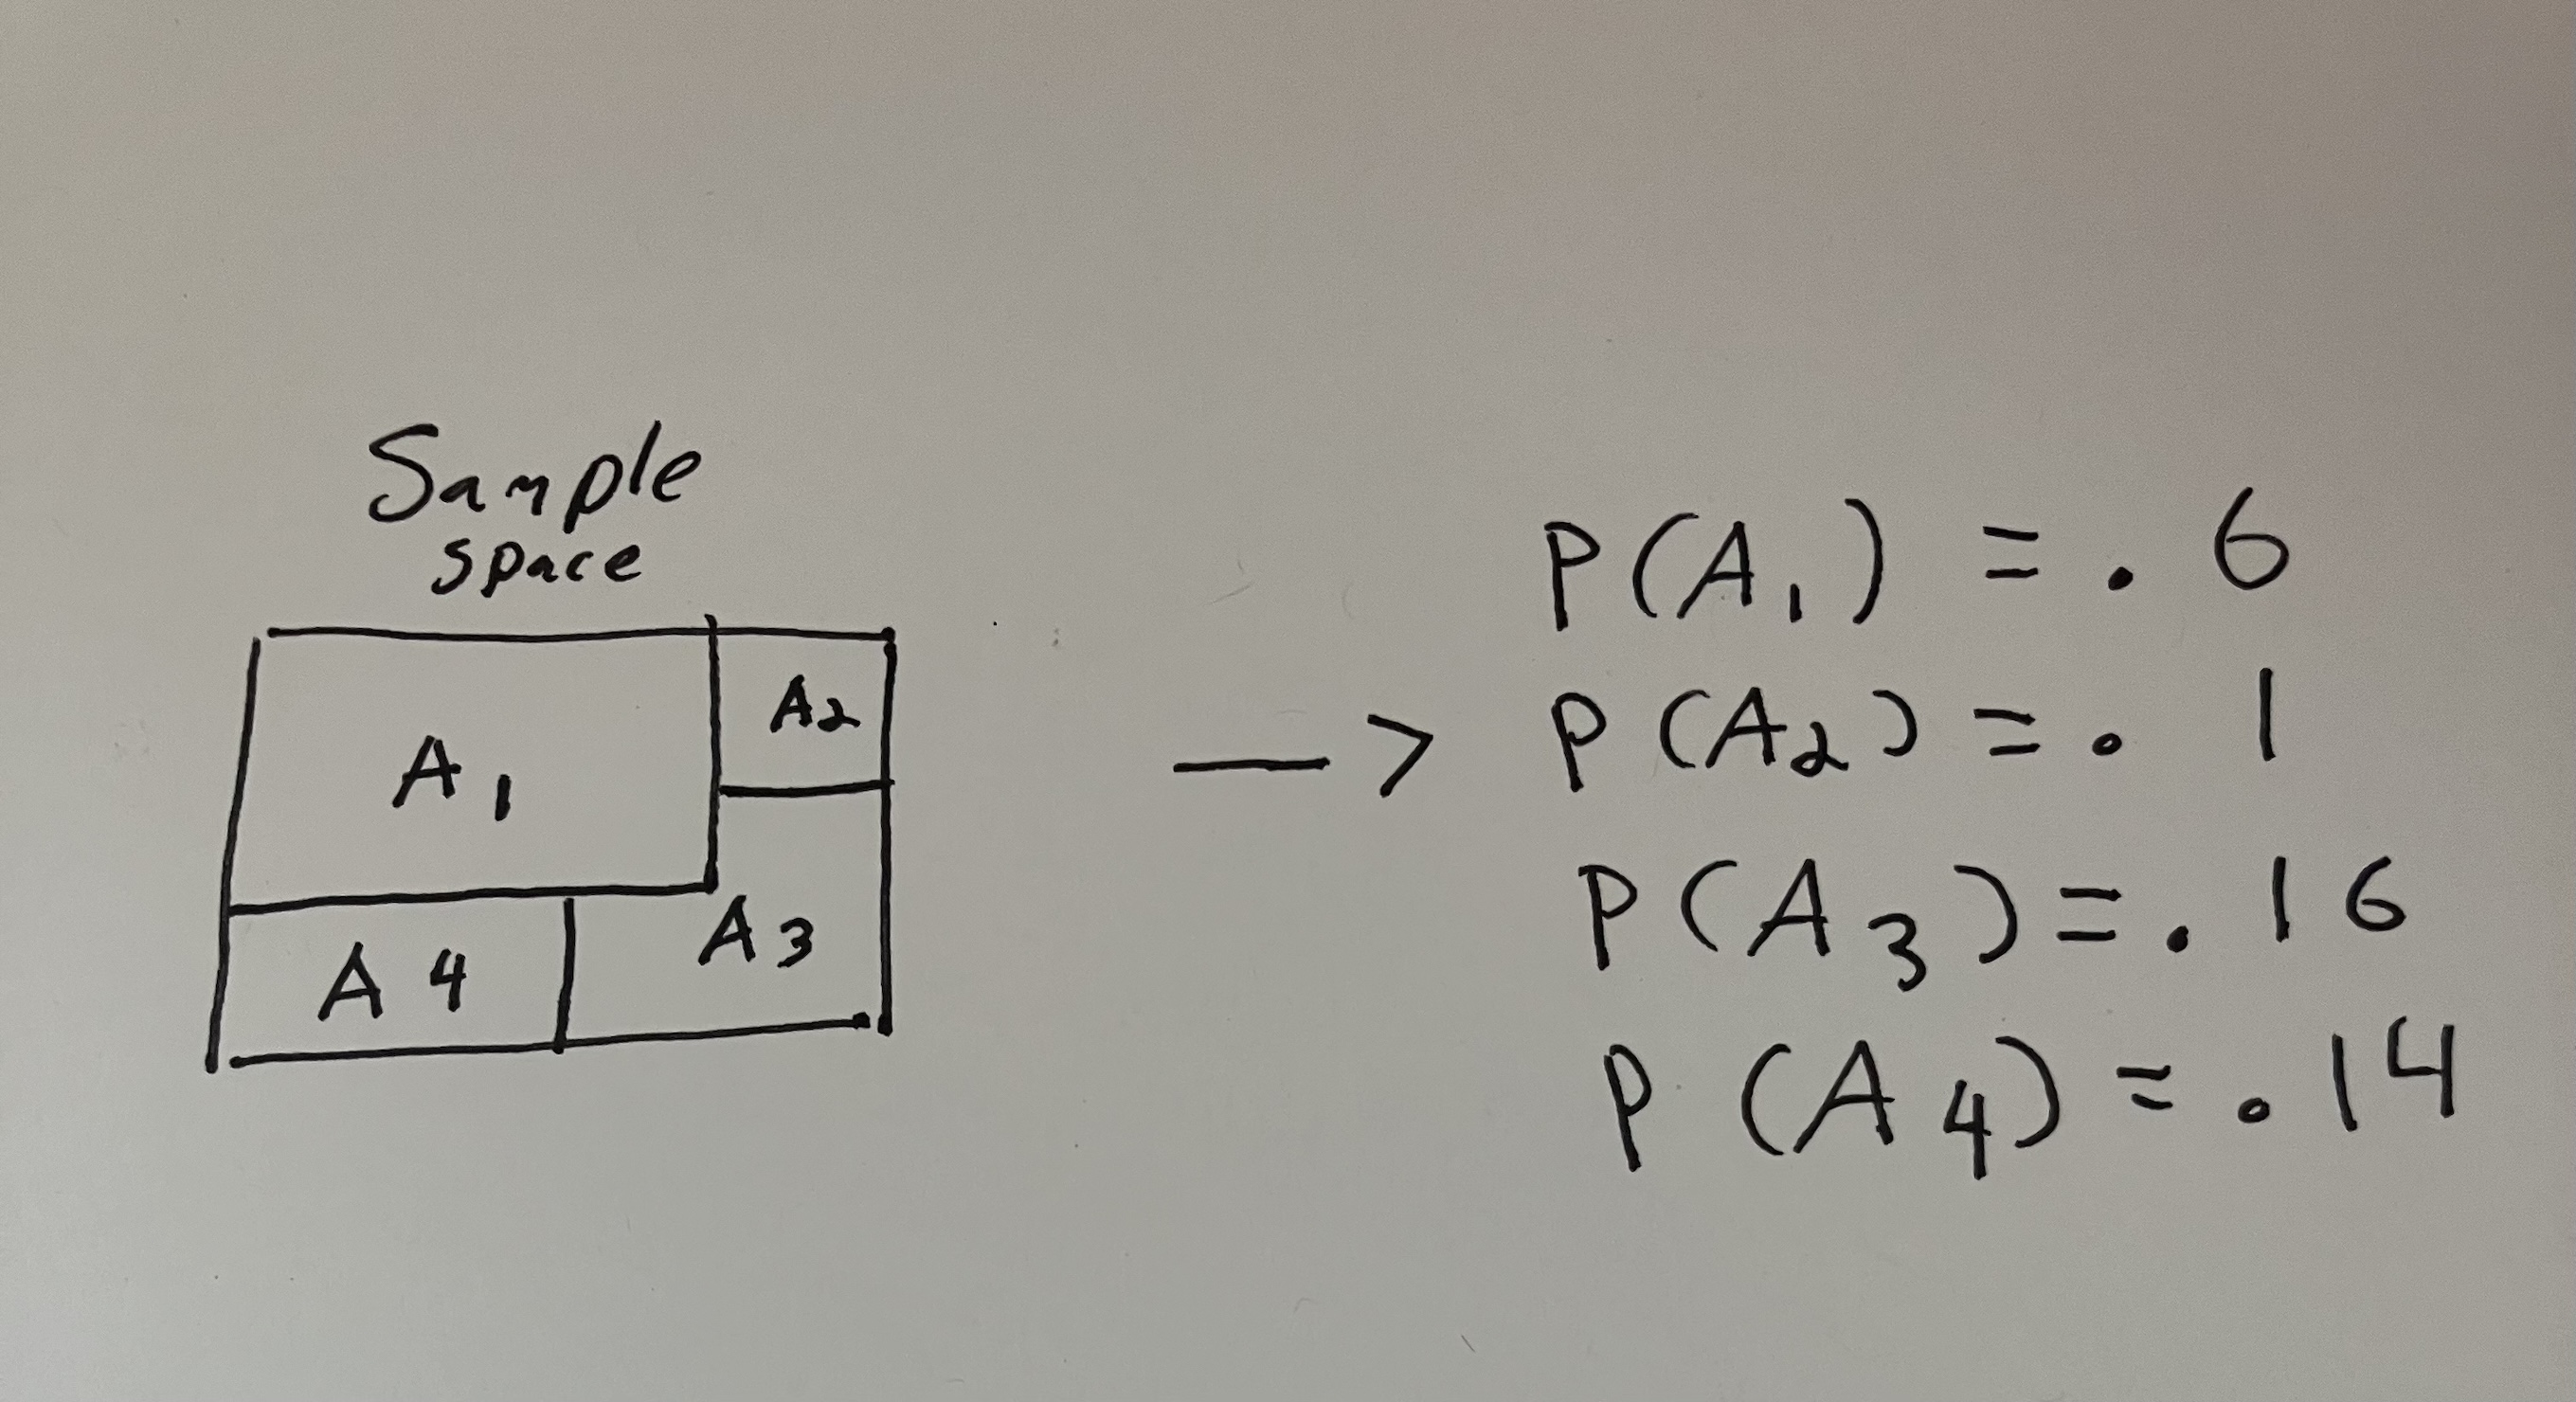
Sample Spaces and Events
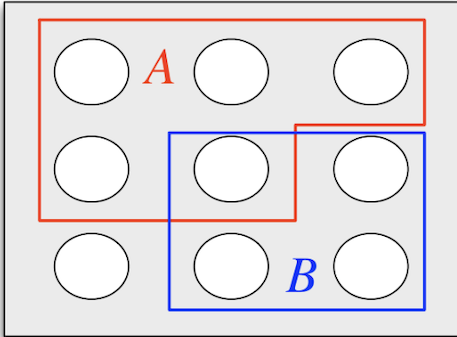
A sample space is the set of all possible outcomes or states. An event A is a subset of the sample space S
The sample space can be finite, countably infinite or uncountably infinite. If it is finite, we can visualize it as below:
Events in the Social World
This all might seem quite abstract…what are some sample spaces and events we might care about?
Political Science: Sample space might be decisions made by the electorate. A could be the event of voting and B the event of voting for a third party candidate.
Economics: Sample space might be range of labor market outcomes. A might be those currently employed and B might be those looking for a new job.
Education: The sample space could be the range of educational outcomes, where A is those who have at least some college.
Union and Intersection
A \(\cup\) B is the union of Events A and B.
A or B (including A and B)
A \(\cap\) B is the intersection of A and B
A and B
A\(^C\) is the complement of A
Everything that is in S but not in A
Naive Definition of Probability
What is the probability of B occurring?
Looks like 4/9, if we just take the number of outcomes in B and divide by the number of outcomes in S. But….what assumptions are we making?
S might not be finite
Some events may be more likely (have more mass) than others
Multiplication Rule
Multiplication Rule
Imagine a race with 25 runners, where runners are awarded Gold, Silver and Bronze medals. How many combinations of medal winners are there?
Multiplication Rule
Imagine a race with 25 runners, where runners are awarded Gold, Silver and Bronze medals. How many combinations of medal winners are there?
There are 25 potential first place winners. Once we know this, there remain 24 potential second place winners. And so on (n) * (n-1) * (n-2)…
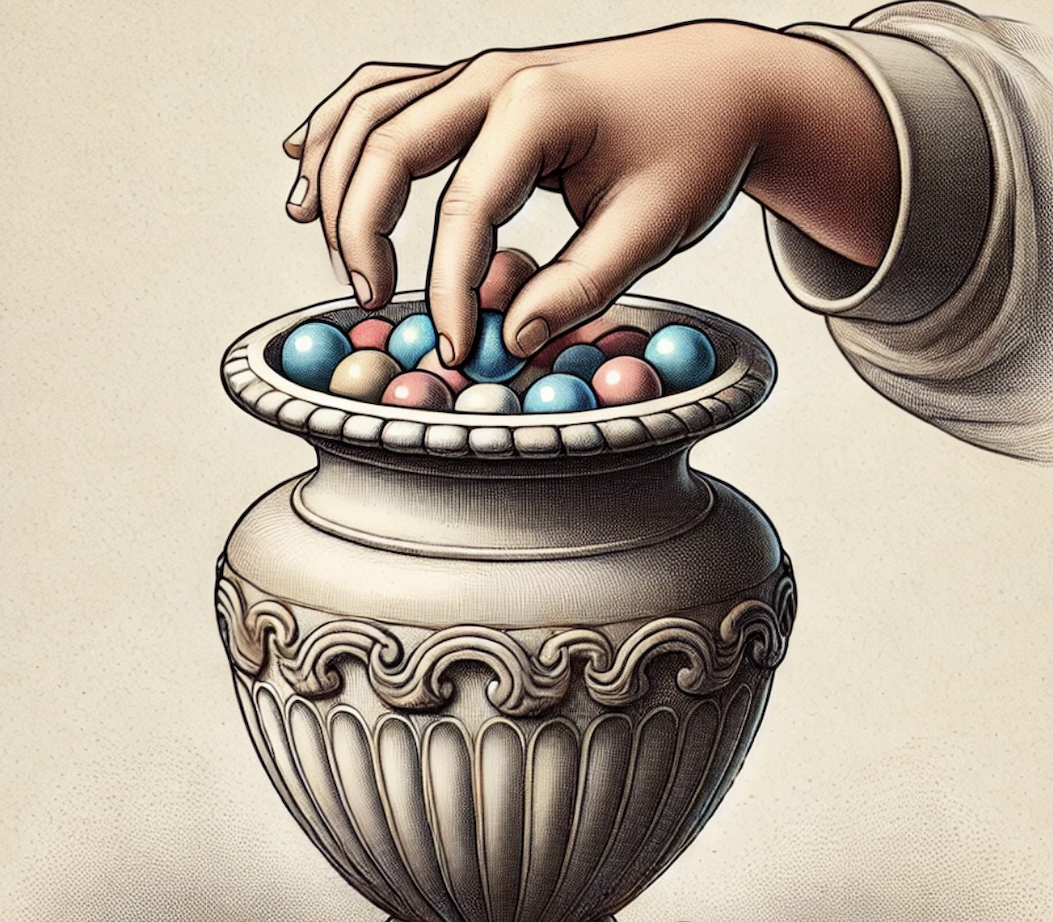
Sampling with Replacement
Consider N objects, from which we make K choices, with replacement. Assume that order matters {1,2} != {2,1}
Sampling with Replacement
Consider N objects, from which we make K choices, with replacement. Assume that order matters {1,2} != {2,1}
Then the number of possible outcomes is \(n^{k}\). Why?
Sampling Without Replacement
Consider n objects from which we make k choices without replacement.
Sampling Without Replacement
Consider n objects from which we make k choices without replacement.
From the multiplication rule, there are n(n-1)(n-2)….(n-k+1) possible outcomes.
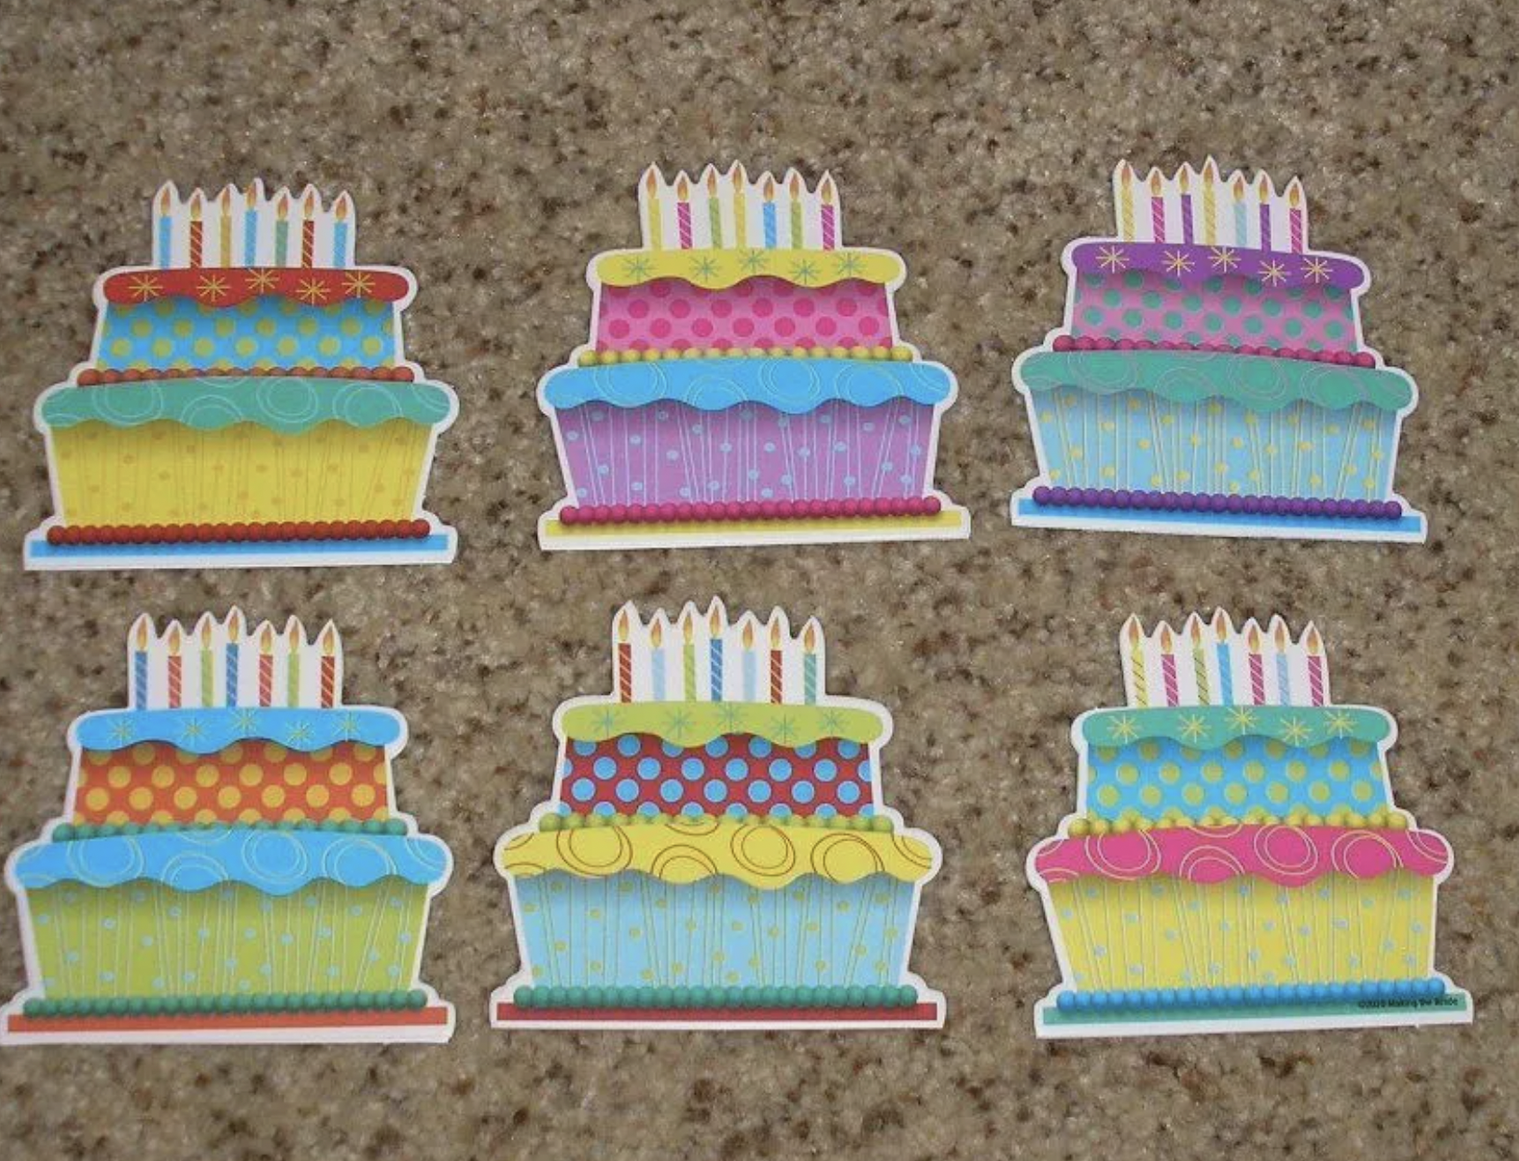
Let’s work through an example
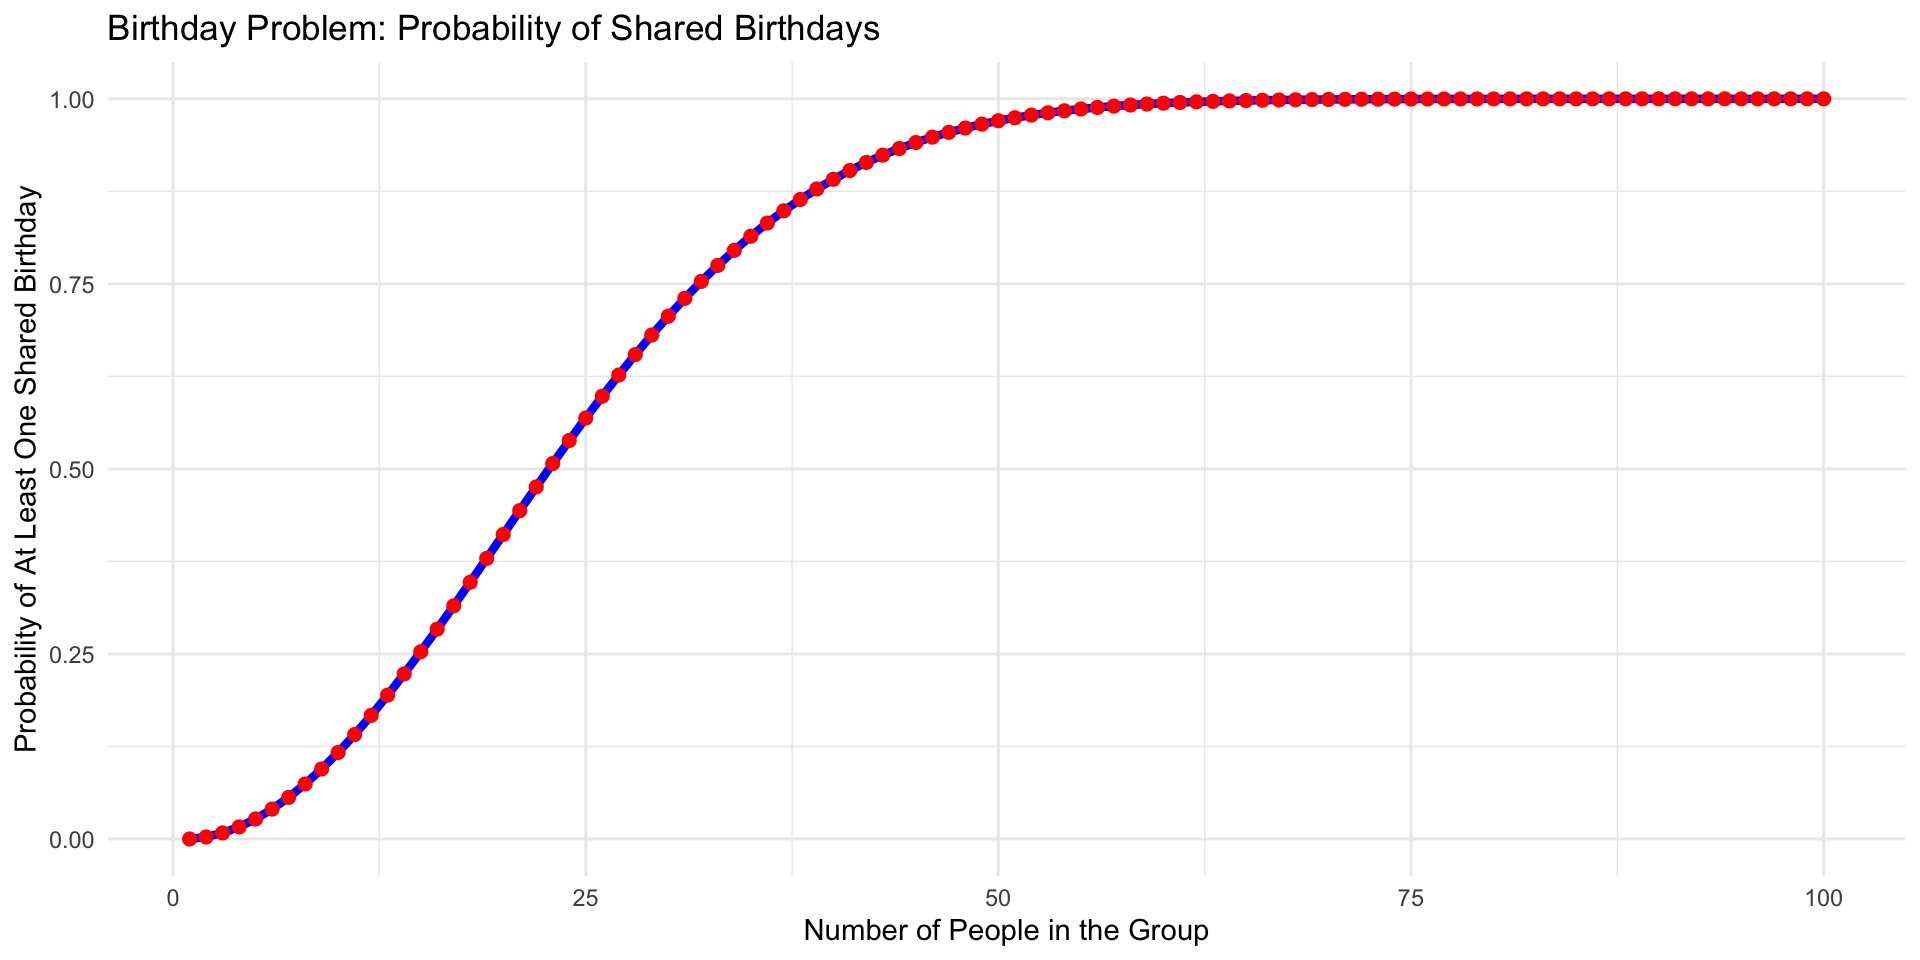
What is the probability that two people in this class share a birthday?
Plotting the Birthday Problem
Code Behind the Plot
library(ggplot2)# Function to calculate the probabilitybirthday_prob <-function(n) {if (n >365) return(1) prob <-1for (i in0:(n-1)) { prob <- prob * (365- i) /365 }return(1- prob)}# Number of people in the groupn <-1:100# Calculate probabilitiesprobabilities <-sapply(n, birthday_prob)# Create a data frame for plottingbirthday_data <-data.frame(GroupSize = n, Probability = probabilities)# Plotting the birthday problemggplot(birthday_data, aes(x = GroupSize, y = Probability)) +geom_line(color ="blue", size =1.5) +geom_point(color ="red", size =2) +labs(title ="Birthday Problem: Probability of Shared Birthdays",x ="Number of People in the Group",y ="Probability of At Least One Shared Birthday") +theme_minimal()
Adjusting for over counting
How many ways are there to chose a three person committee from five people?
List them all out (123)(124)(125)(134)(135)(145)(234)(235)(245)(345). So, there are 10 ways to form this committee.
or, we can use the multiplication rule. There are 5 ways to chose spot 1, 4 ways to chose spot 2, 2 ways to chose spot 3….but this over counts because order does not matter.
Binomial Coefficients
This leads to a more general concept - the Binomial Coefficient\(n\choose k\) or “n choose k”. This is the number of subsets of size k for a set of size n.
\[
\frac{(n)(n-1)(n-2)....(n-k+1)}{k!}
\]
if k < n
Equivalently
\[\frac{n!}{(n-k)!k!}\]
General Definition of Probability
A probability space consists of a sample space S and a probabilty function P which takes an event A in S as an input and returns P(A) (the probability of A occuring), a real number between 0 and 1 as output
Axioms of Probability
P(\(\emptyset\)) = 0, P(S) = 1
If \(A_{1}\) , \(A_{2}\) are disjoint (non-overlapping) then P(A \(\cup\) B) is P(\(A_{1}\)) + P(\(A_{2}\))
The following are important properties
P(\(A^{c}\)) = 1 - P(A)
If A \(\subseteq\) B, then P(A) \(\leq\) P(B)
P(\(A \cup B\)) = P(A) + P(B) - P(\(A \cap B\))
Conditional Probability
Conditional probability is the heart of modern statistics and social science. Getting a firm grasp on conditional probability is the most important thing we do this semester!
Unconditional Probability: What is the probability that A occurs?
Conditional Probability: If we know B has occurred, what is the probability that A occurs (not necessarily sequential)?
We condition our estimate of A on B having occurred.
Could spend a whole semester on conditional probability and fun examples.
Conditioning is the whole game!
What is the probability that a child goes to college conditional on being treated by some policy intervention?
What is the difference in probability of being hospitalized for COVID among vaccinated and unvaccinated populations?
Are citizens more likely to vote if they are reminded that their decision to vote, or not vote, is visible to everyone?
Nearly all of social science is comparing probabilities (or means or other values) between different conditions!
Drawing Cards
Consider a standard 52 card deck. Let A be the event of drawing a Spade and B be the event of drawing a red card.
What is P(A)?
What is P(B)?
What is P(A|B)?
What is P(B|A)?
More Social Science Examples
What is the probability of two states going to war if they are both democracies?
What is the probability of a recession in 2025 if the unemployment rate rose in 2024?
What is the probability of a military coup in Brazil if consumer prices double?
Definition
If \(P(B)\) > 0, then we define the conditional probability of A given B as:
\[
P(A|B) = \frac{P(A \cap B)}{P(B)}
\]
How often A and B jointly occur, divided by how often B occurs. Why do we need to divide by B?
Example
What do we think \(P(\text{Policy Nerd} | \text{POST PhD Student})\) is?
What about \(P(\text{POST PhD Student}|\text{Policy Nerd})\)?
Often assumed that \(P(\text{Post PhD Student|Policy Nerd})\) should also be high. This is referred to as the base rate fallacy. With cohorts of ~ 5 students, simply cannot be high!
Intuition
Weather
Let A = Presence of clouds and B = Rain
What is \(P(A|B)\)? (Don’t over-think it - we don’t need math here!)